Put your data to work
Your crew collects hundreds of datapoints each day. Each measurement has implications for the quality and profitability of your brewing.
Use your data science to enable strategic recipe development, monitor equipment, educate staff, align SOP execution, and brew beer of lower cost and higher quality.
Explore how data analysis informs production:
Mill
Use first runnings °P trends to determine in the mill.
Monitor mill performance over time, receiving flags when issues arise.
Use data-backed sieve test results instead of arbitrary standards.
Discover ideal mill gaps for individual malts or individual brands.
Milling analytics commonly lead to 5% savings on malt COGs.
Mash
Use mash-in duration data to determine ideal strike GPMs for homogenous mashes.
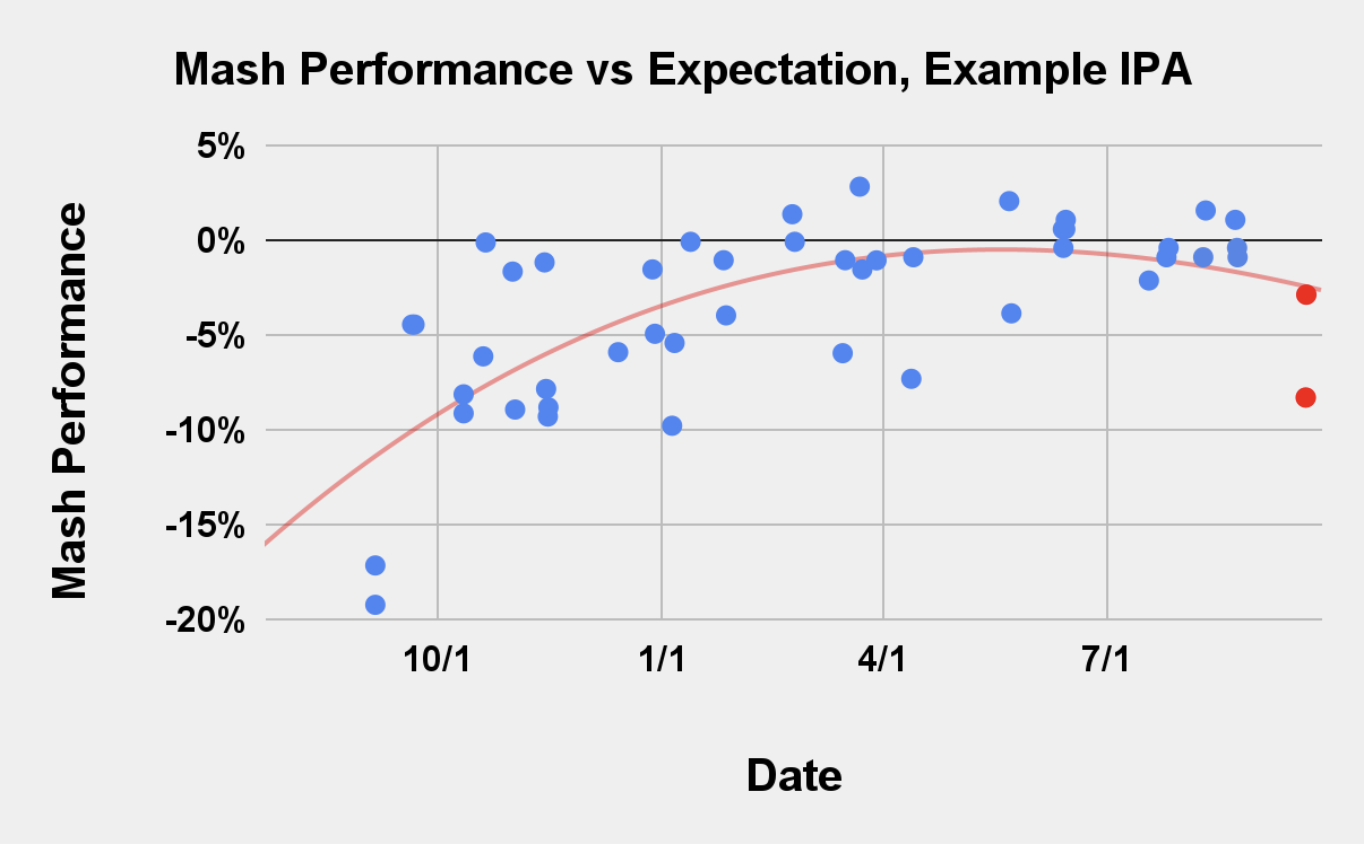
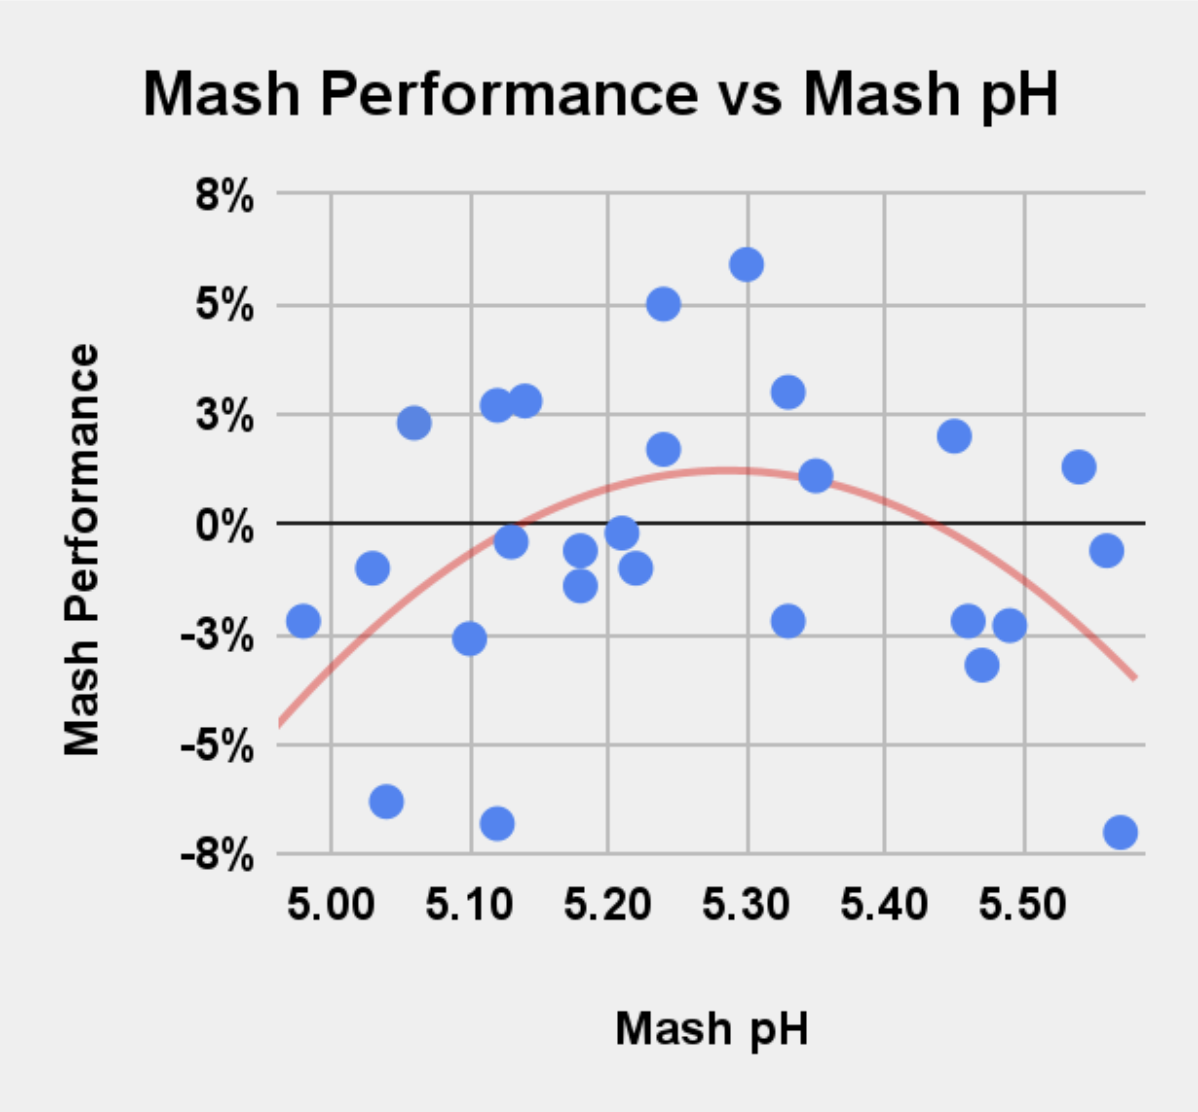
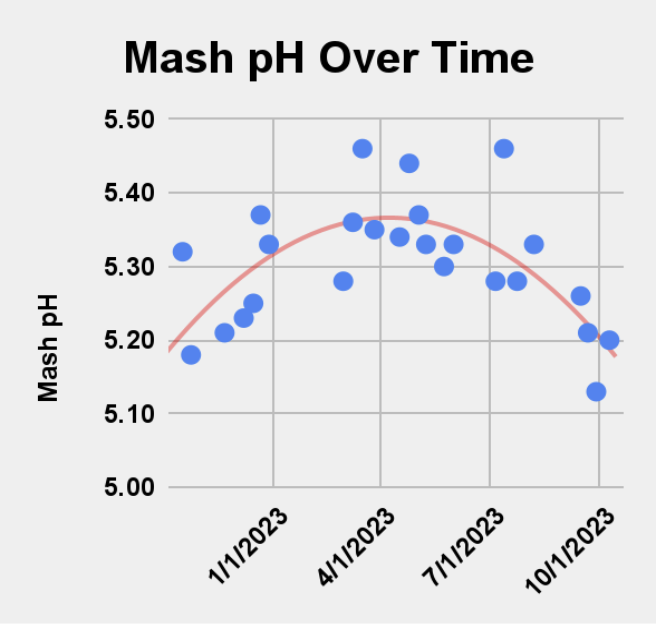
Determine mash thickness, duration, pH, and temperature SOPs that achieve your efficiency and fermentability goals.
Monitor analytics for each brewer to discover differences in SOP execution and brewer performance.
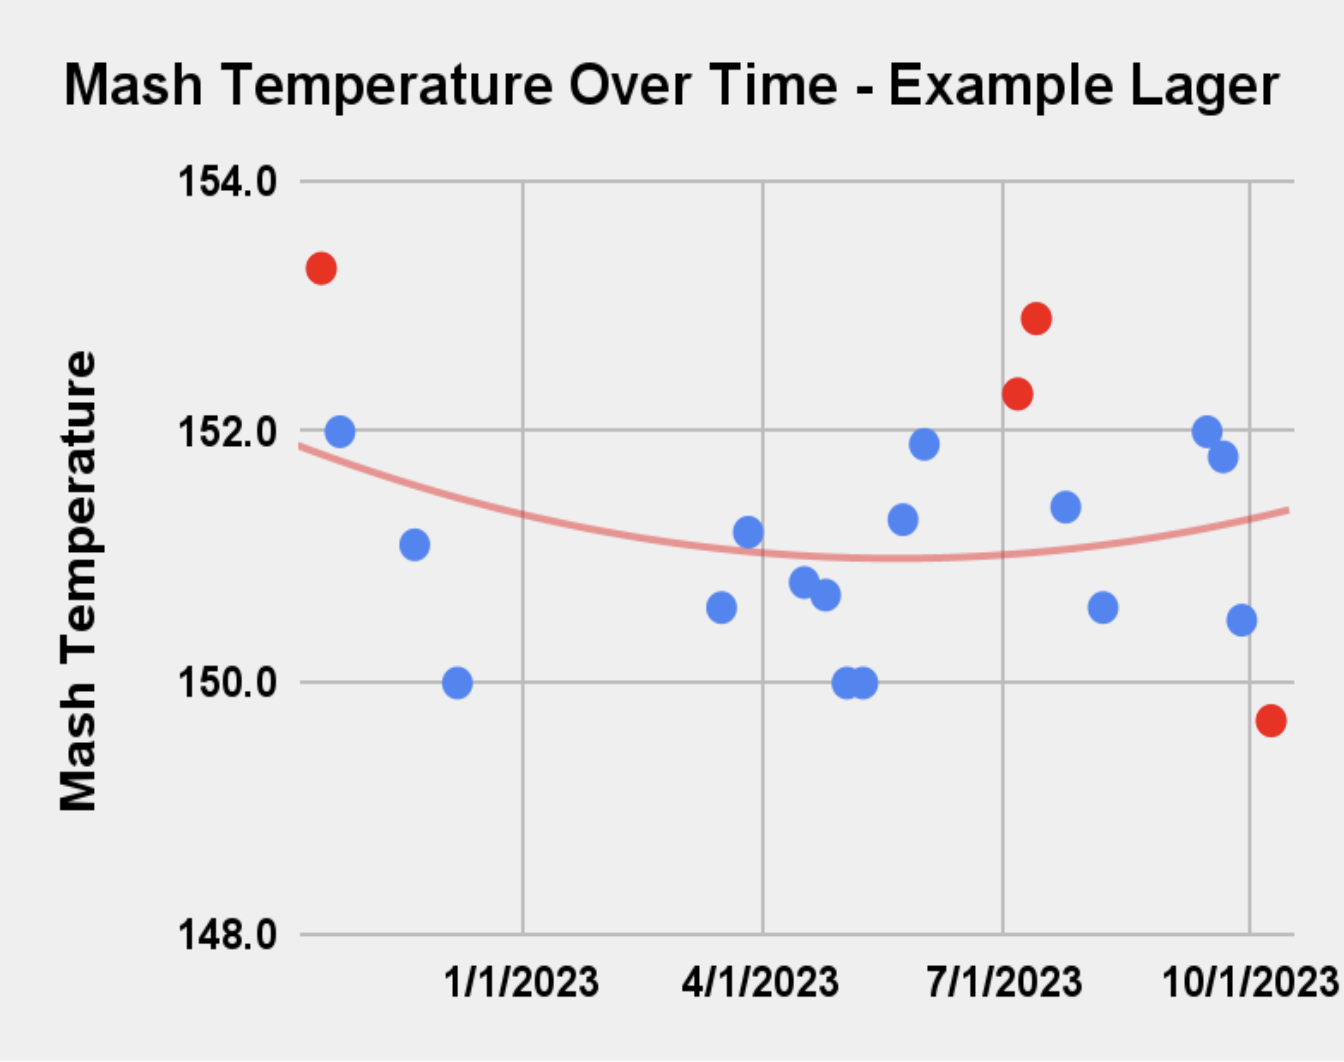
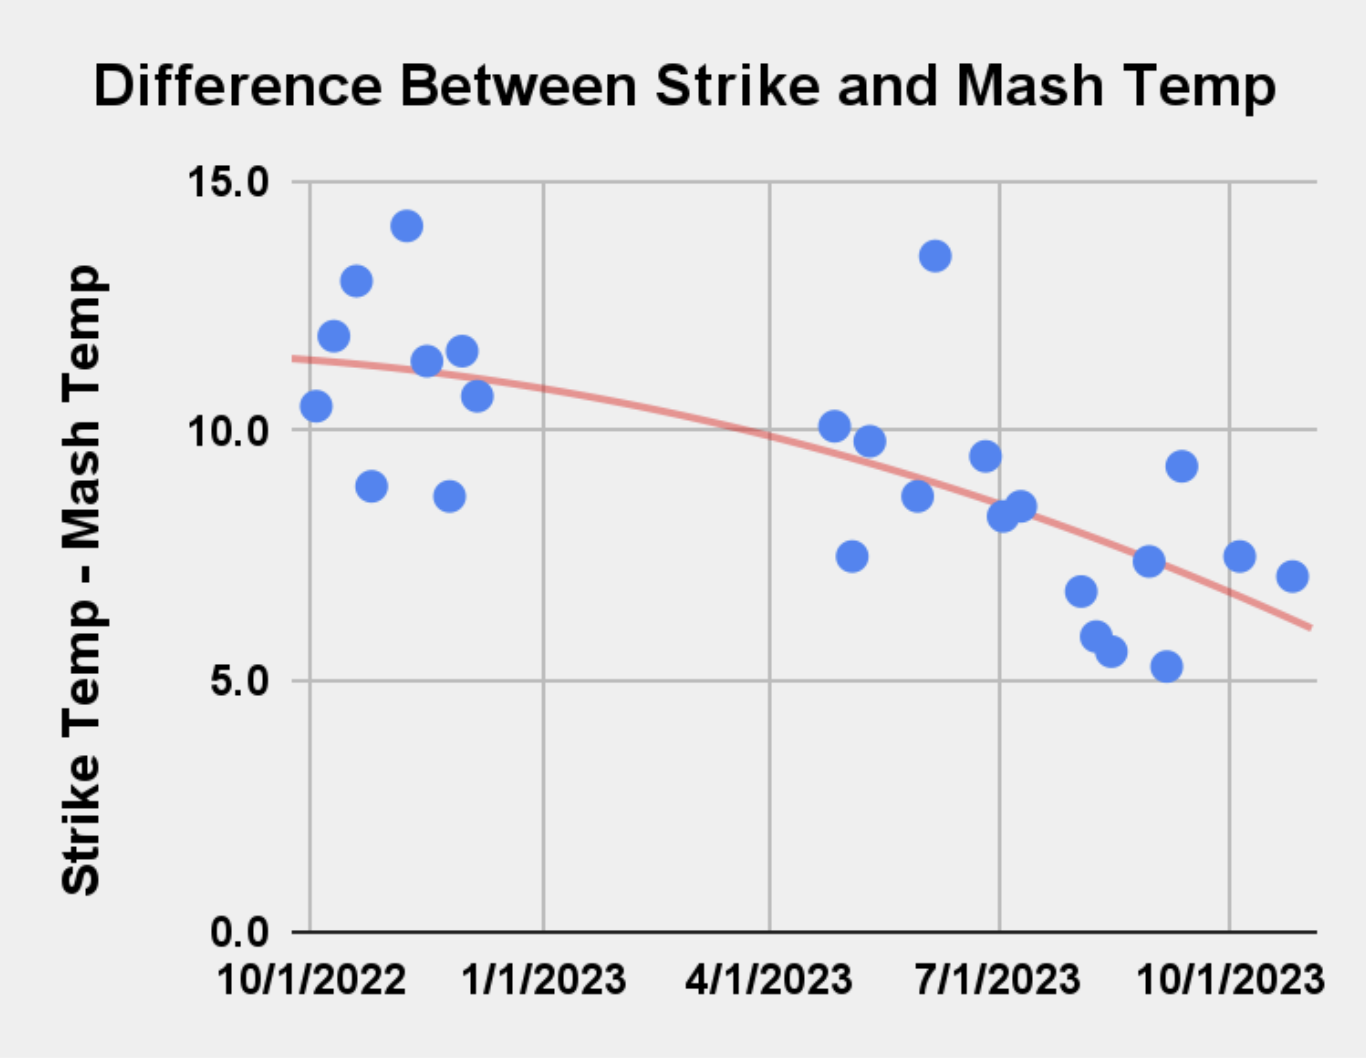
Monitor seasonal and SOP-based changes in mash temperature, and use a data-derived formula to calculate the correct strike temperature.
Produce beer of the desired sweetness and clarity while saving another 3% on malt COGs.
Lauter
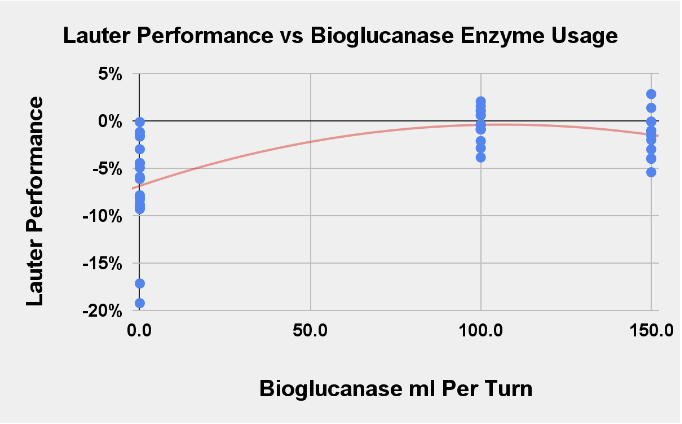
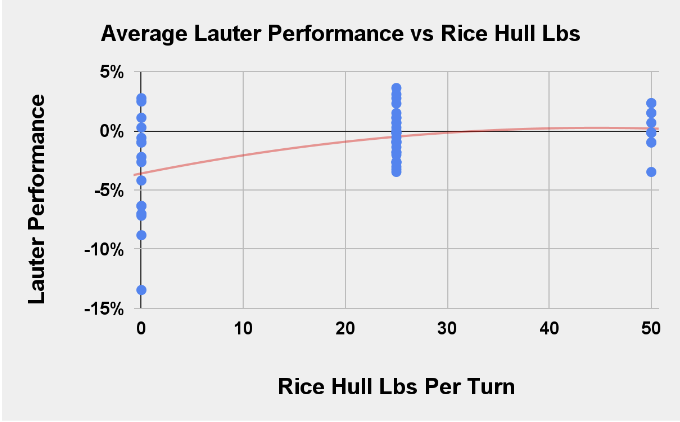
Use the gap between first runnings °P and kettle full °P to pinpoint issues in the lauter.
Determine ideals for:
Rice hull %
Vorlauf speed/duration
Sparge start timing
Lauter speed/duration
Enzyme usage
Sparge temperature
Grain crush (too fine)
Save another 3% on malt COGs.
pH Control
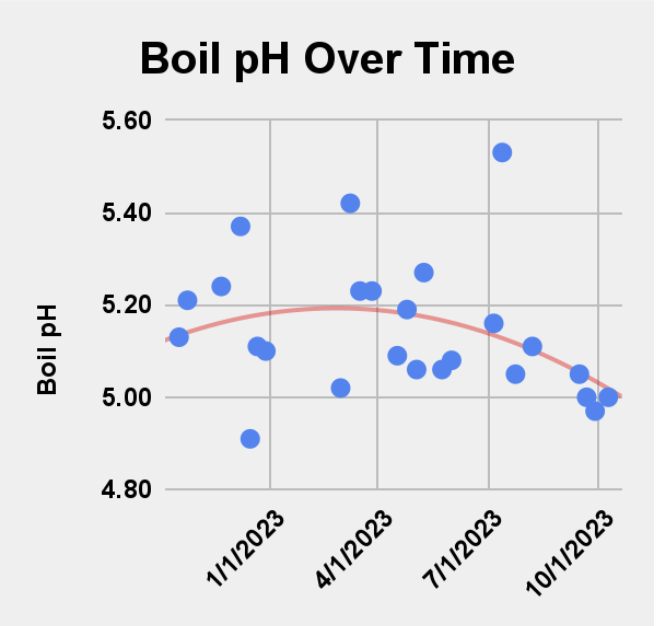
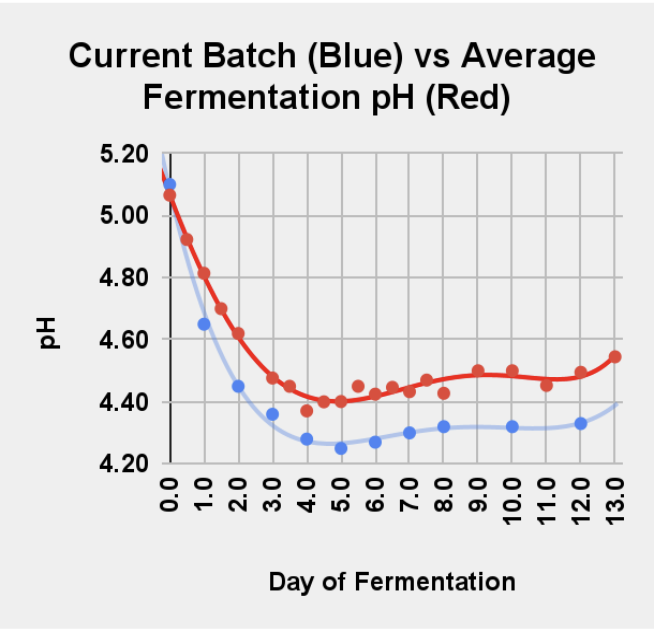
For each brand or style group, monitor the following pH trends:
Mash
Boil
KO
Final pH
Use pH increases in the whirlpool and final dry hop to evaluate hop extraction.
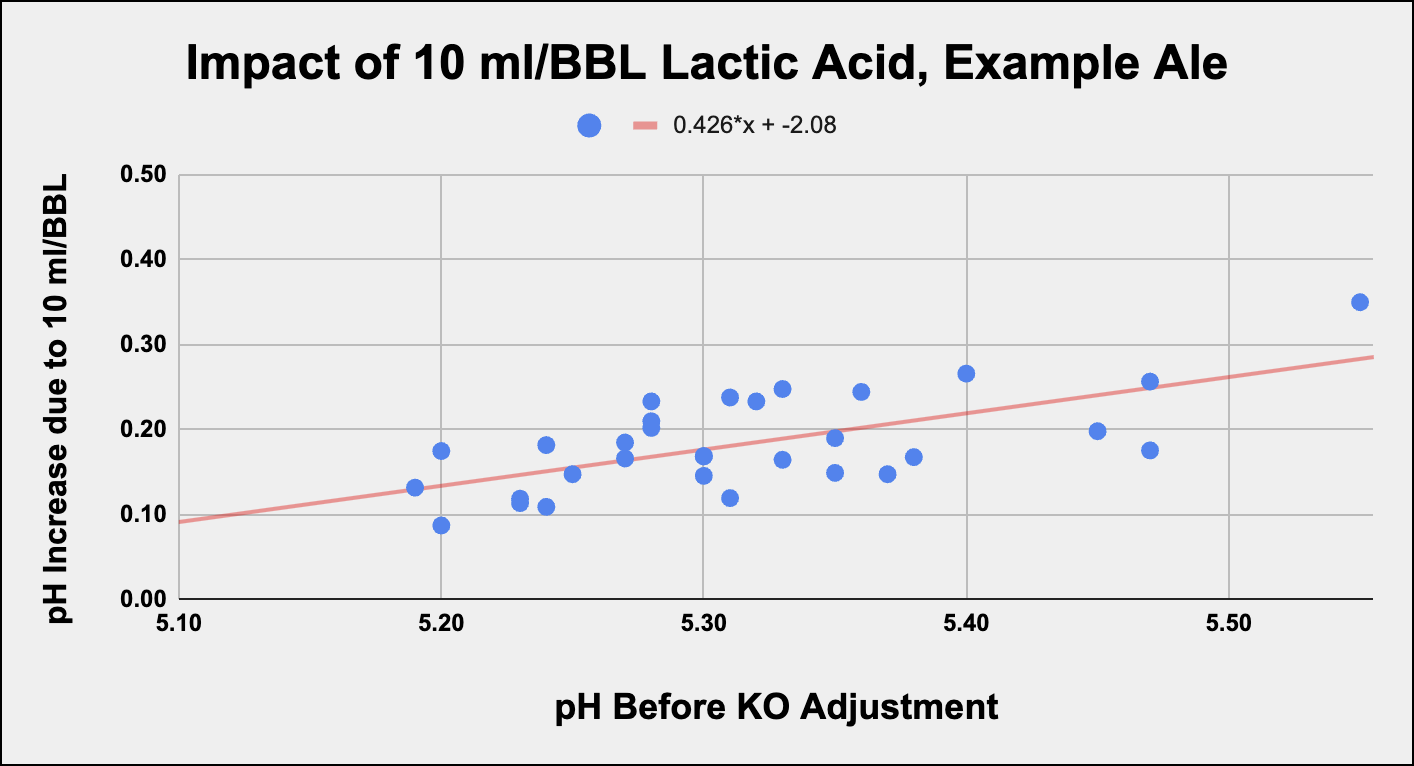
Receive data-derived calculations for pH adjustments at every process point.
Knockout
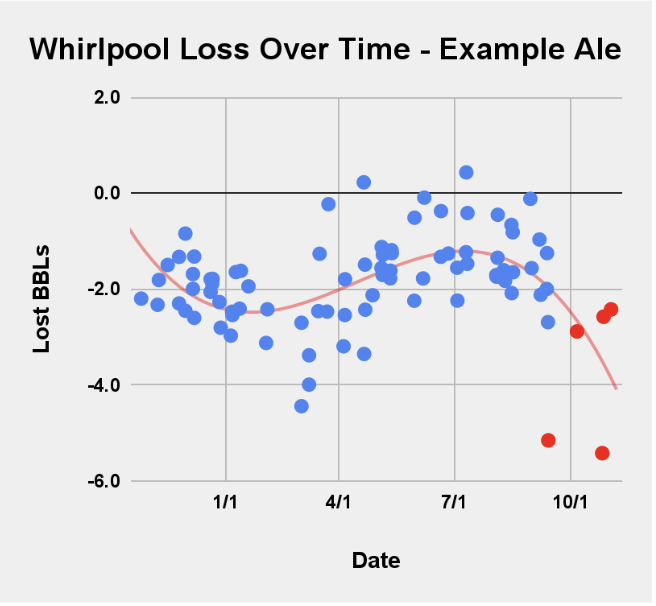
Track whirlpool loss to determine the impact of hopping rates and hopping products.
Receive formulas that predict whirlpool loss during recipe design.
View whirlpool loss by brewer initial to identify SOP differences.
Use the Grimm Analytics Knockout spreadsheet to receive data-derived calculations upon entry of your boil end and cast details.
Dilutions
O2 ppm estimates from O2 LPM and KO flow rate
KO pH adjustment calculations
Ferment
Track fermentation precision in each brand to control your timelines and QC.
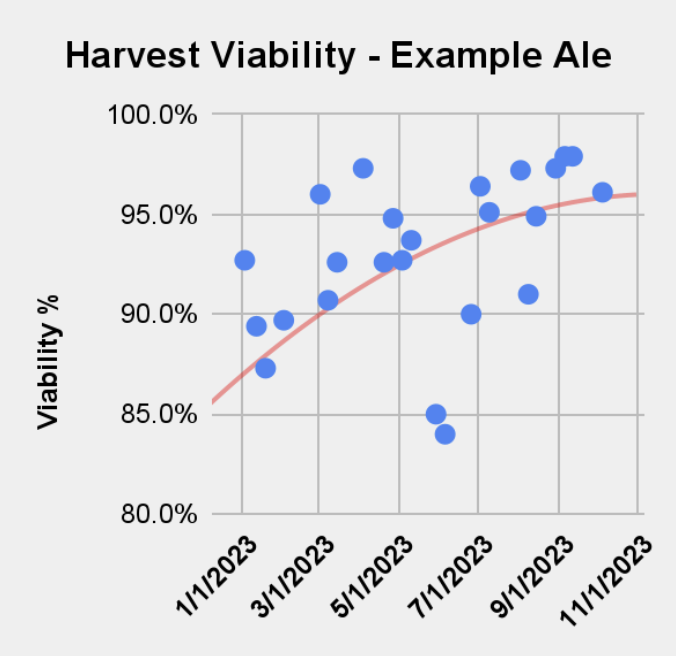
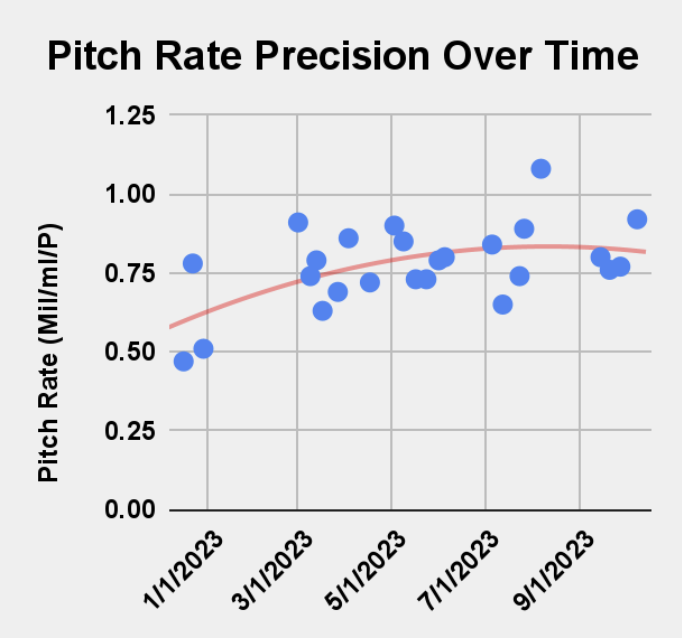
Determine ideal pitch rates, O2, and yeast nutrition via analysis of timelines, harvest viability, and harvest density.
Track issues that stem from storage SOPs or yeast generation.
Monitor sweetness and ABV precision in each brand.
Discover the impact of mash temperature, duration, and grist diastatic power on attenuation at your brewery.
Post-Ferment
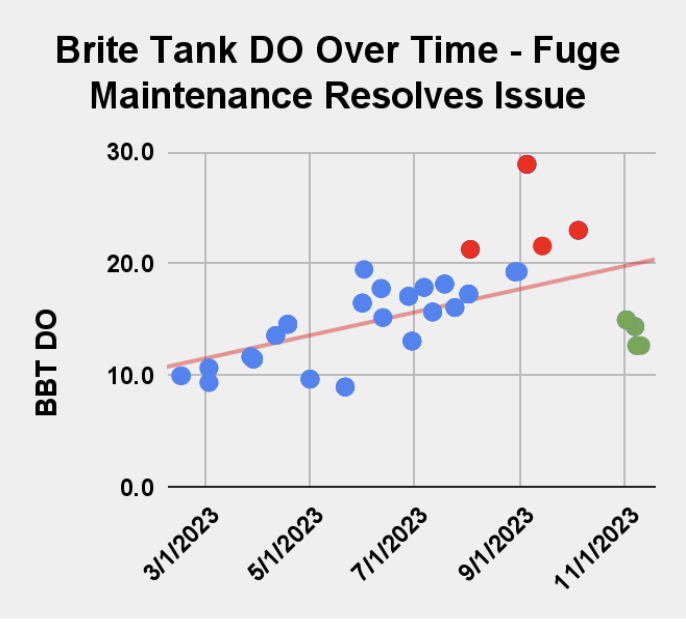
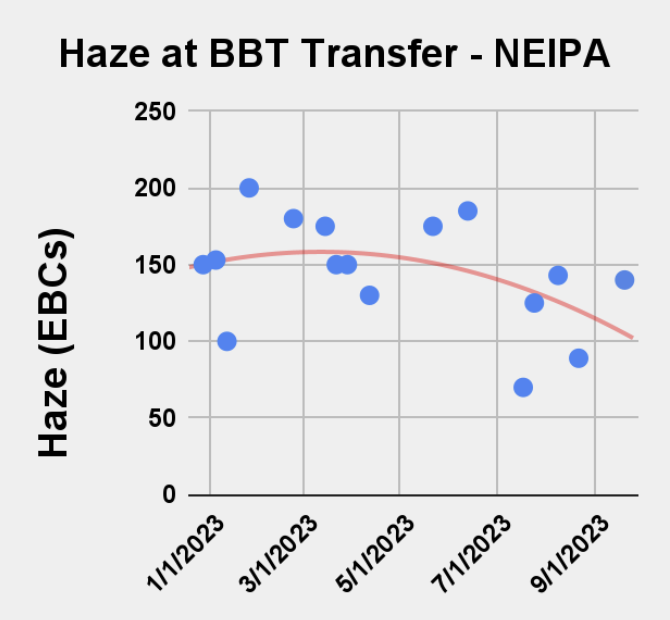
Monitor centrifuge performance via transfer DOs and haze analytics.
Correlate fuge EBCs (haze) with other production metrics and ingredients.
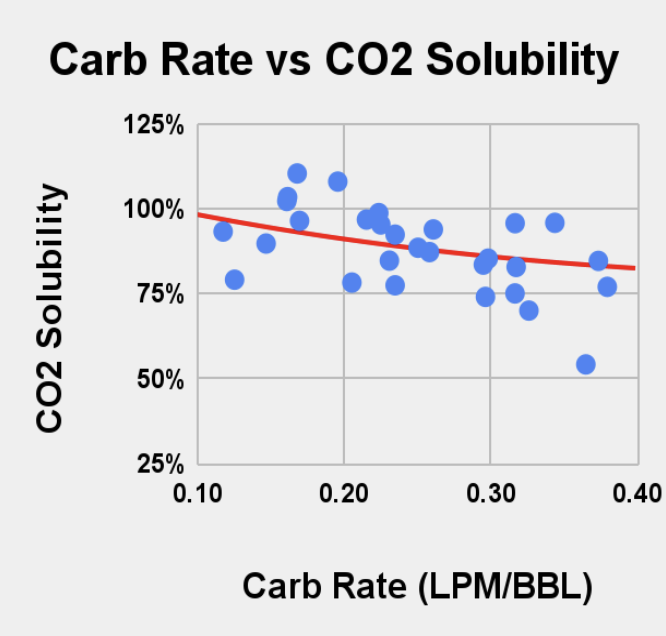
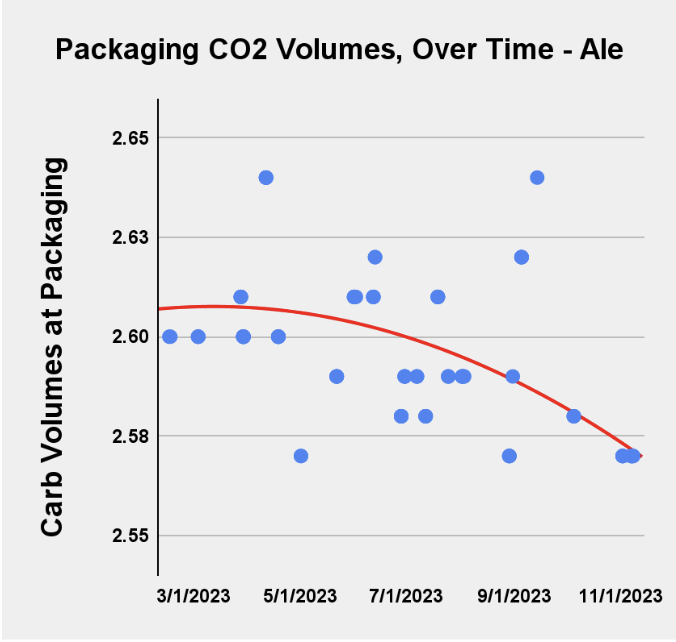
When carbing using a known CO2 output (i.e. via a CO2 flowmeter), enter data into my carbonation app to receive analysis on CO2 solubility and carb stone health.
Enter the duration of the carb run, the volume in BBLs, the starting CO2, and the target CO2 to receive an LPM setting for your flowmeter.
Collects all necessary data to create predictable carbonation SOPs.
Monitor the precision with which beer is carbed and delivered to the canning line at the chosen temperature, creating the conditions for consistent canning.
Canning
Click here for info on my canning app, a customizable supplement to Beer30.
More comprehensive data collection
Naturally guides the creation of canning SOPs for each brand
Responsive analytics support canning in real time
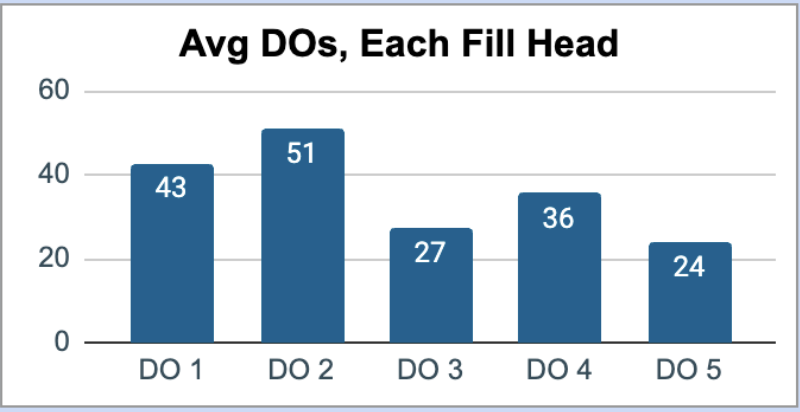
Reduce DO and weight variation from fill head to fill head.
Correlate canning SOPs with “Weight Split”, or the difference in weight between heaviest and lightest cans in a set.
Variation must be low before you can establish a single desired weight/DO/CO2 outcome for your cans.
Dial in canning SOPs by correlating beer conditions and line settings with improved performance metrics.
Correlate canning outcomes to “Activity”, a metric uniting temperature and carbonation to describe how foam-positive the product will be.
Save 2-5% on canning yield.
Reduce losses due to overfilled cans and excessive foam loss.
Reduce low-fill cases and startup loss by creating reliable SOPs and precise beer conditions.
Yields
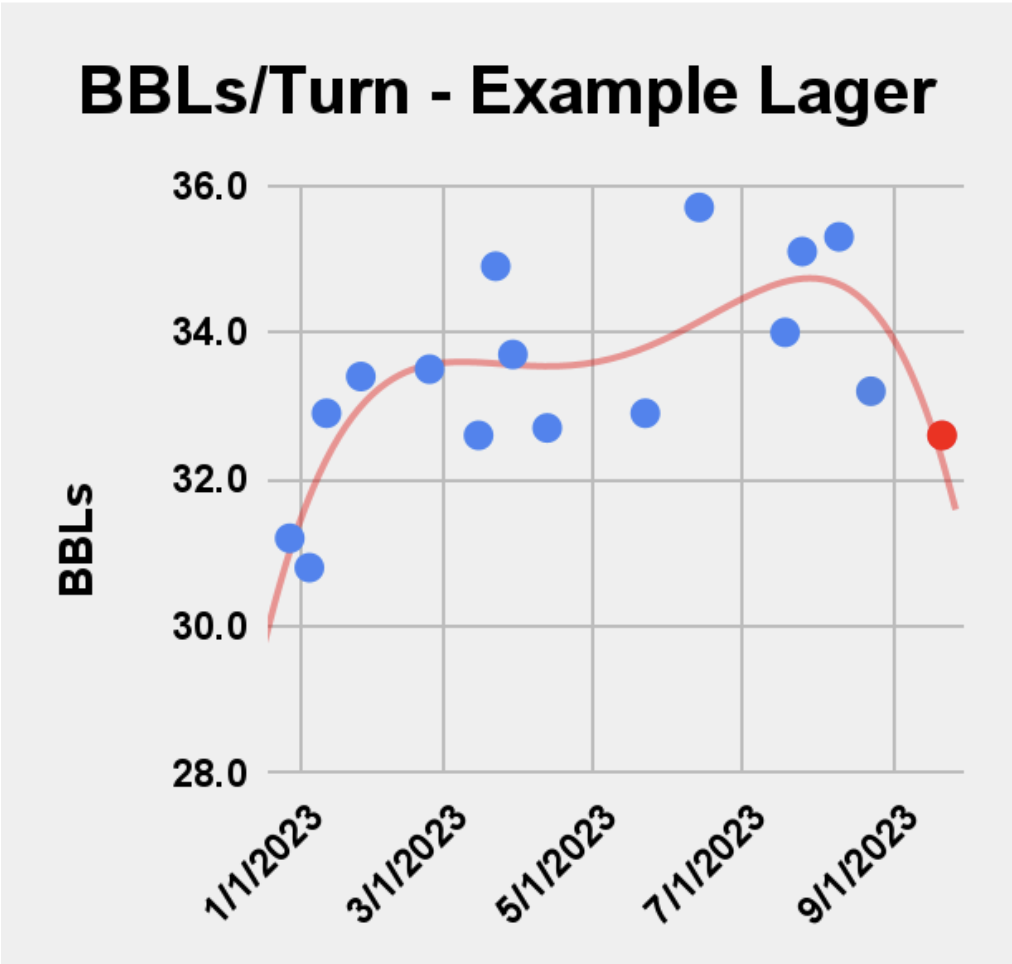
Monitor FV and BBT fill % and use brewhouse efficiency analytics to deliver precise and complete fills.
Develop dump, crash, and transfer SOPs to maximize trub density and increase yields.
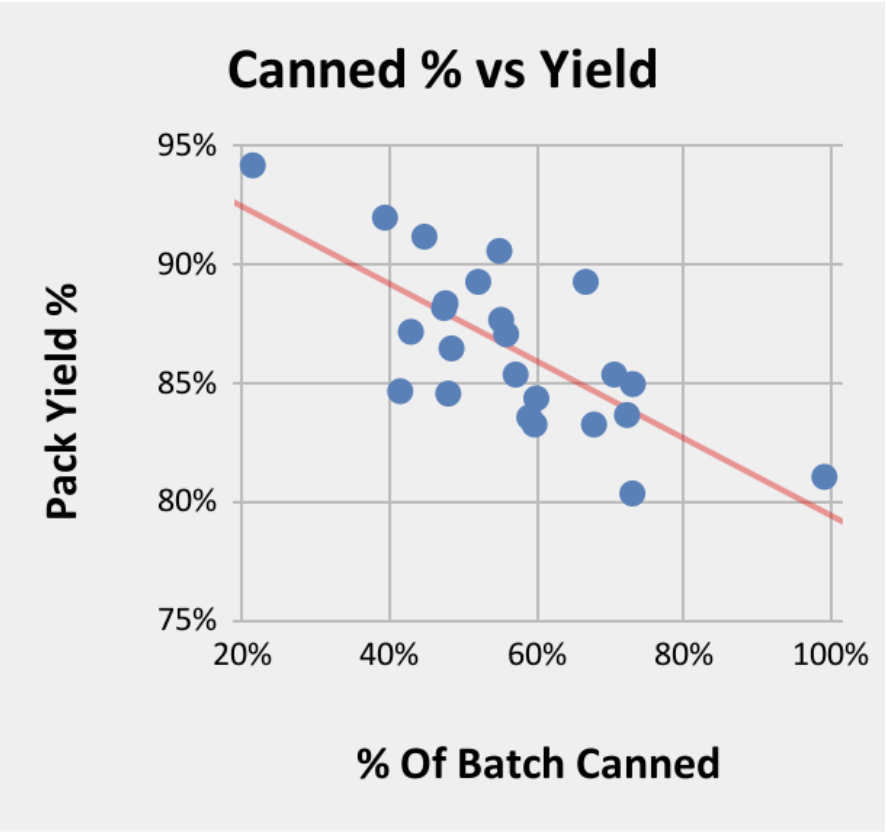
Correlate harvest/dump density to its impact on pack yield %.
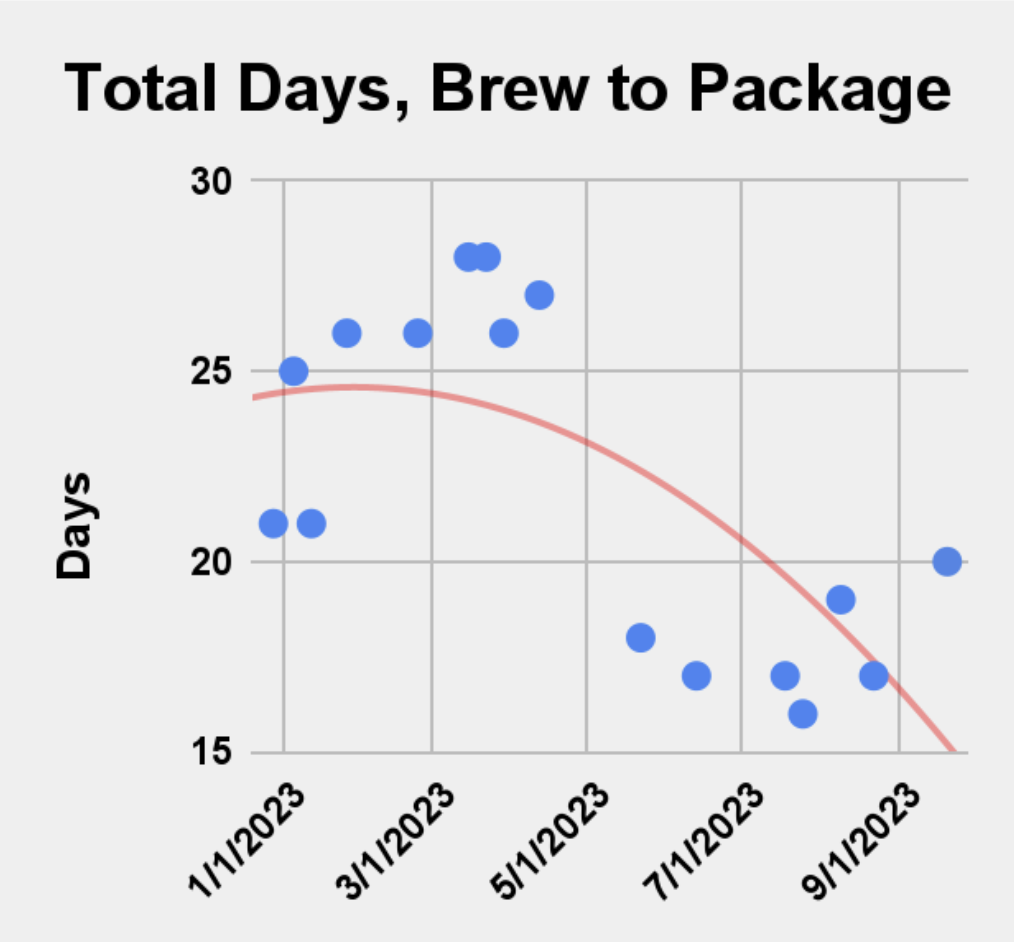
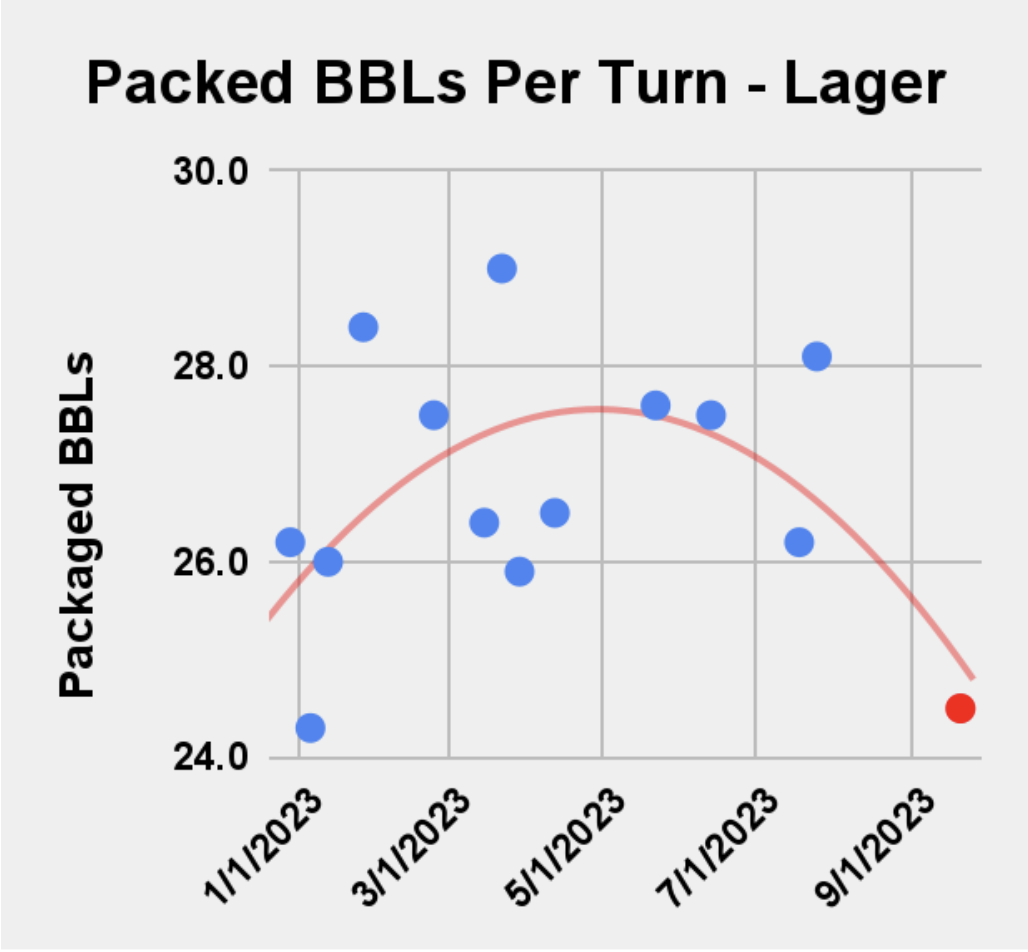
Work with me to develop schedules that produce beer efficiently and create outstanding yeast management rhythm.
Monitor can and keg data to control weights and foam loss.
Improve packaged yield % by 5% or more.
Increase factory output by 25-50% with minimal impact upon labor and without additional tanks.
QC
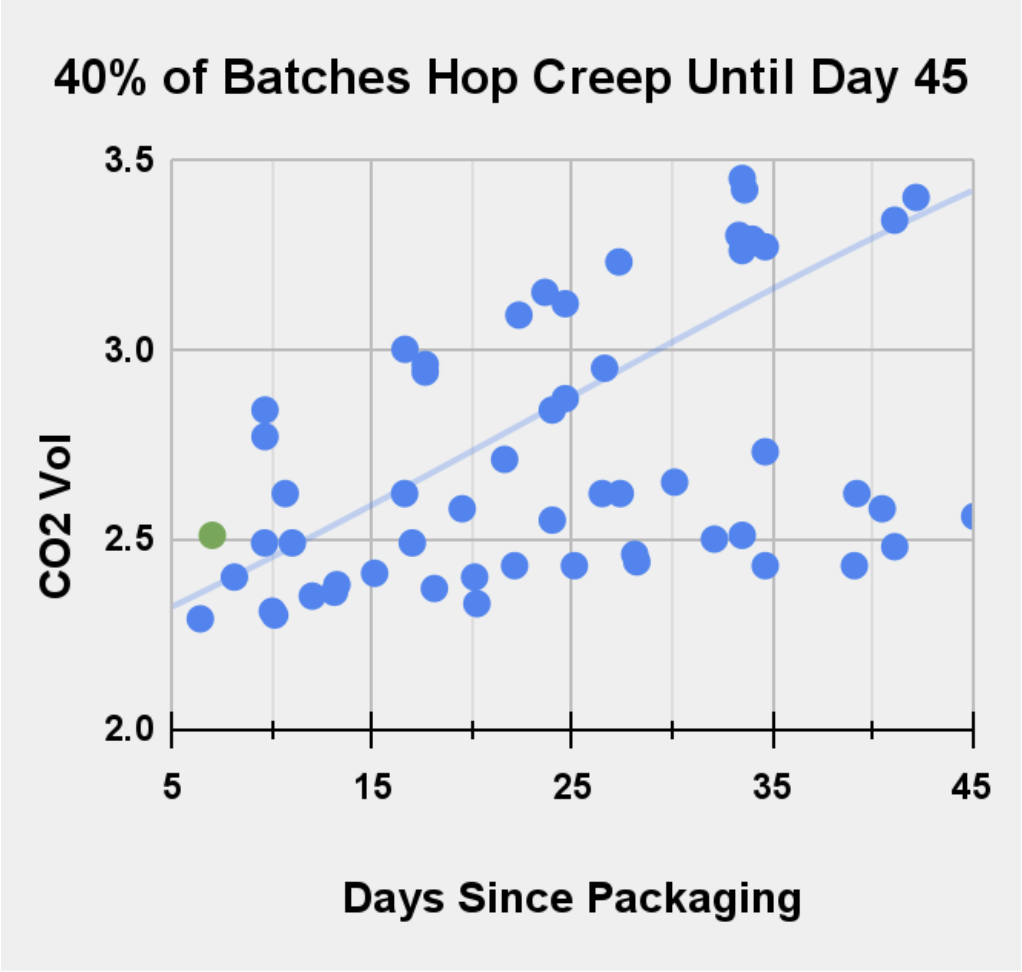
Enter lab data into my custom QC apps to receive analysis on micro, hop creep, VDK tests, and more.
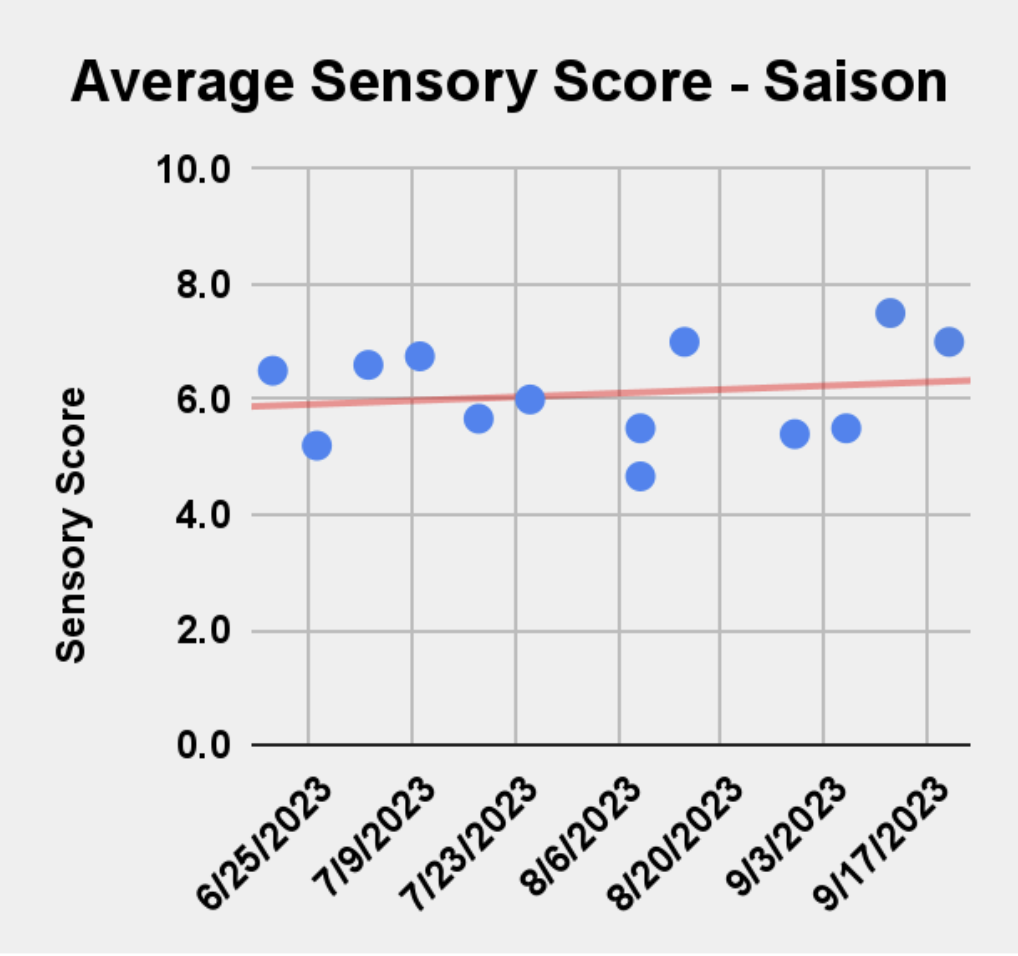
Use sensory data to support the strategic confirmation or rejection of new SOPs and recipe edits.
Sensory data reporting reinforces good tasting habits amongst the crew and encourages long-term interest in brand development.


